
Dangerous Buildings in Cyprus, Mapped: What the New Layers Reveal
New GIS layers on our webviewer plot every officially registered dangerous building in Nicosia, Limassol, Larnaca and Famagusta, using data from the District Organisations of Local Administration (EOA). Here's what the numbers show.
Why this matters
Since April 2025, responsibility for identifying and managing unsafe structures in Cyprus has shifted from municipalities to the newly formed District Organisations of Local Administration (EOA). Each EOA now keeps its own register of buildings that inspectors have classified as either dangerous or in need of repair, and several have started publishing that data through interactive registries and maps.
We've now brought four of these official datasets — Nicosia, Limassol, Larnaca and Famagusta — into a single set of layers on our webviewer, so you can see registered unsafe buildings alongside cadastral parcels, zoning, and other spatial layers in one place.
What the layers show
Each layer plots buildings that an EOA has formally logged, generally distinguishing between:
Declared dangerous — structurally compromised, sometimes requiring evacuation or fencing off
Needs repair — deficiencies identified but not yet rising to "dangerous" status
The numbers behind the risk
The scale differs sharply by district, based on each EOA's most recently published figures:
District Buildings in active register Formally declared dangerous
District | Buildings |
|---|---|
Nicosia | 712 |
Limassol | 52 |
Famagusta (free area) | 20 |
Larnaca | 9 |
A few things stand out. Nicosia accounts for the large majority of all mapped cases — more than ten times the combined total of the other three districts — reflecting both its larger urban stock and the volume of pending cases it inherited when responsibility passed to the EOAs. Limassol and Famagusta sit in a much smaller middle tier, while Larnaca currently shows the fewest cases in the dataset, likely because formal declarations there are still working through an active evaluation process rather than being fully reflected in the register yet.
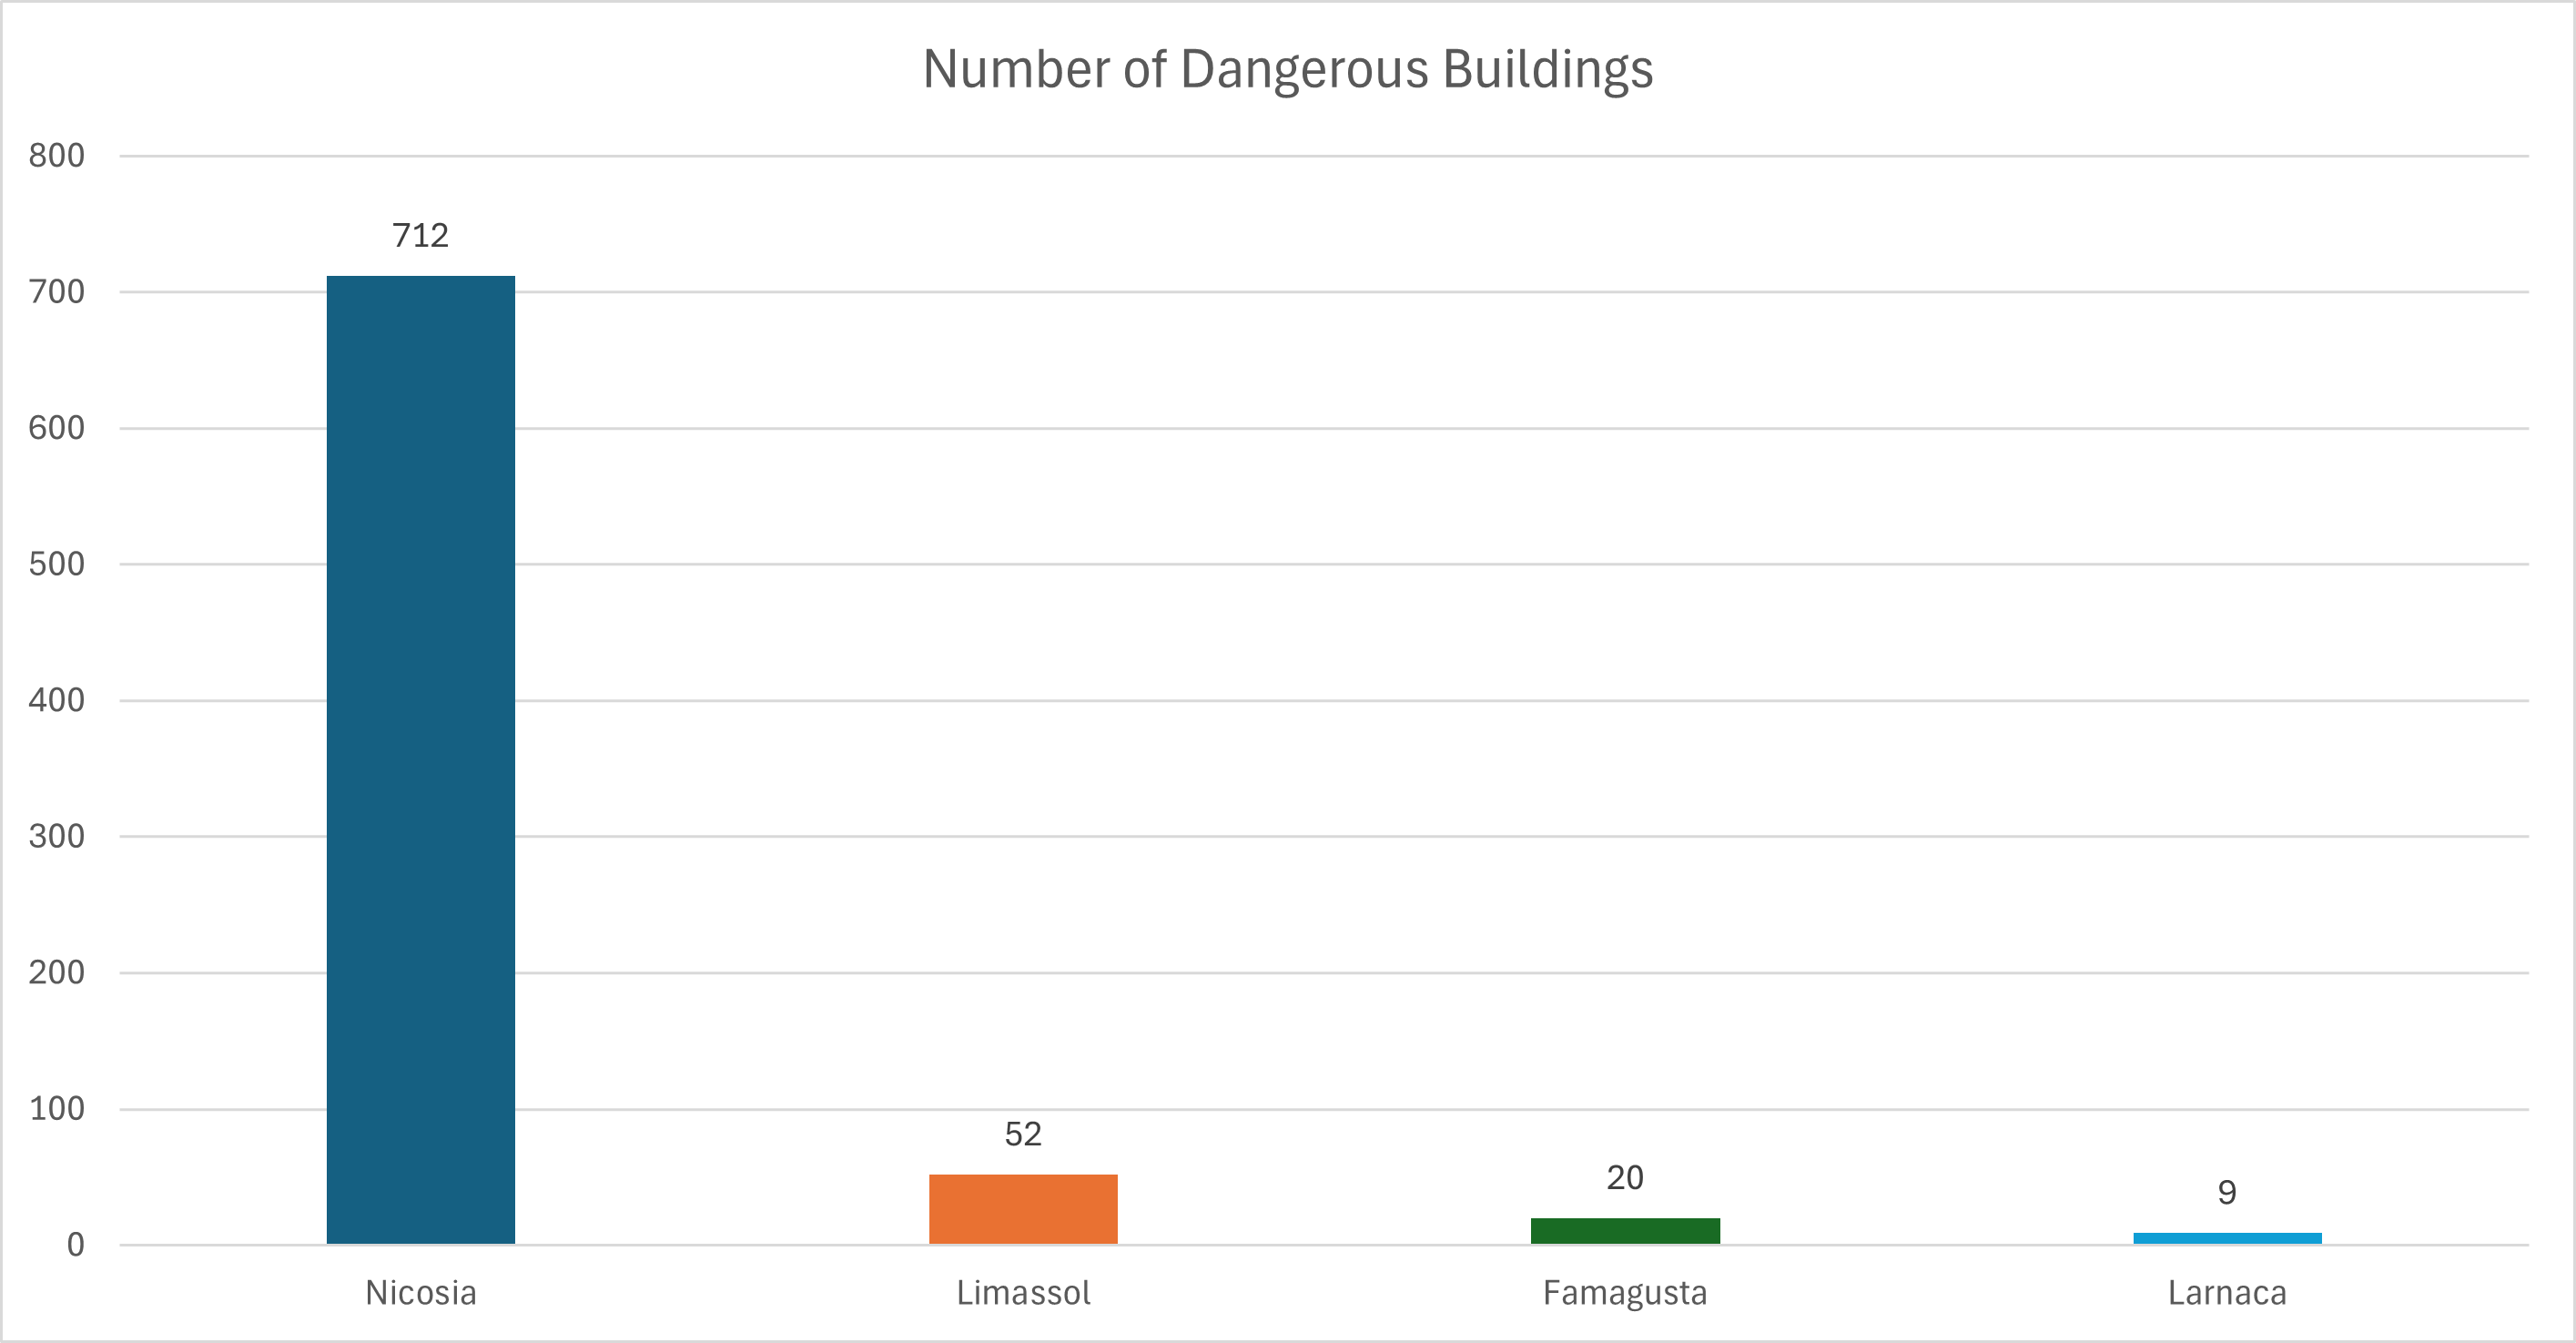
Note: these counts reflect what's currently loaded in each district's layer, and will shift as EOAs complete more inspections and publish updates.
How to use the map
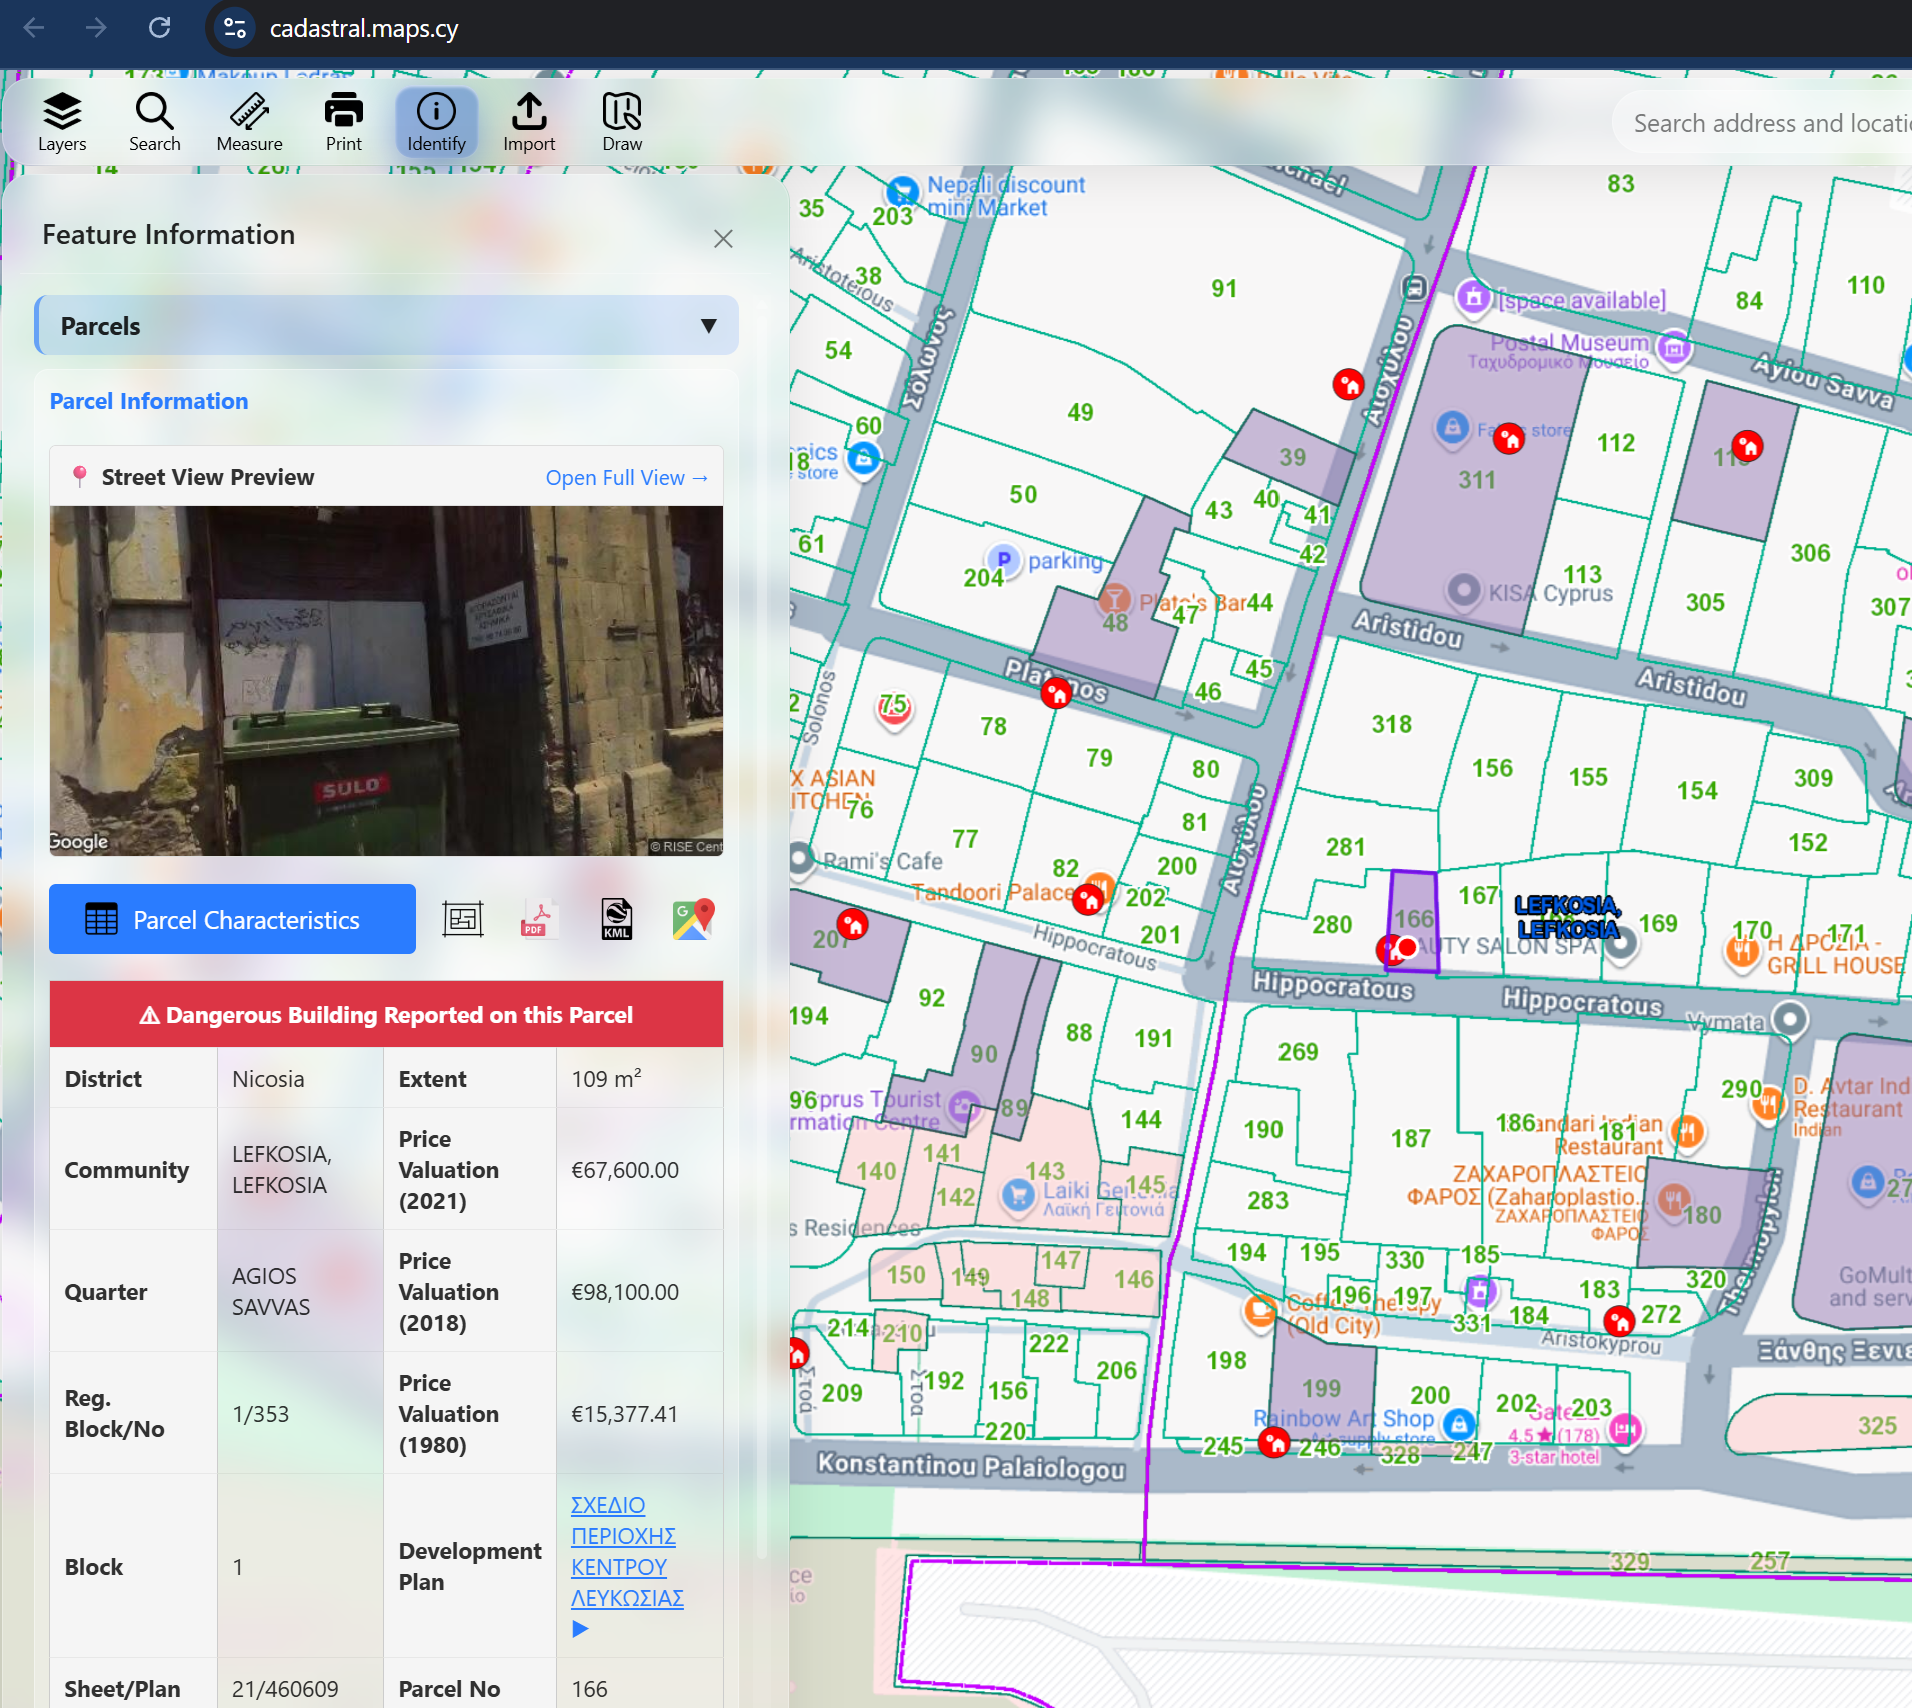
Every registered case is clickable, not just a dot on the map. Click directly on a parcel or on any red marker, and the Feature Information panel opens with a clear red "Dangerous Building Reported on this Parcel" banner — so there's no ambiguity about what you're looking at.
From there, the panel gives you the full context in one place: a Google Street View preview of the actual building, the district, community and quarter, plot extent, registration block/plan numbers, and a valuation history (1980, 2018, 2021) pulled straight from the Land Registry. You can also jump to the parcel's zoning plan, export the parcel characteristics as a PDF or KML, or open the location directly in Google Maps.
That means a property lawyer, buyer, or insurer checking a specific address doesn't just see a warning icon — they get the parcel's legal and valuation record and a photo of the building's actual condition, all in a single click.
A living dataset
These registers are updated as EOAs complete new inspections, so the layers will be refreshed periodically to stay aligned with the official source data.